Nutrient Loss Reduction Strategy
Hypoxia Task Force
Every summer, a large hypoxic zone forms in the Gulf of Mexico. This zone, where the amount of dissolved oxygen is too low for many aquatic species to survive, is fueled primarily by excess nutrients (nitrogen and phosphorus) from the Mississippi River Basin. The nitrogen (N) and phosphorus (P) loads come mainly from sources upstream of the Gulf; including agriculture (both row crop agriculture and animal feeding operations), atmospheric deposition, urban runoff, and point sources such as wastewater treatment plants. Sources of phosphorus include agriculture, urban runoff, wastewater treatment plants, stream channel erosion, and natural soil deposits. The excessive nutrient loads trigger an overgrowth of algae that rapidly consumes oxygen as it decomposes. This decomposition in bottom waters, coupled with water column stratification, results in hypoxia. More information about the Hypoxia Task Force can be found here.

Illinois Nutrient Loss Reduction Strategy (NLRS)
To help protect water locally and downstream, states within the Mississippi River watershed have been developing plans to reduce their contribution of nutrients. The U.S. Environmental Protection Agency (U.S. EPA) 2008 Gulf Hypoxia Action Plan, calls for each of the 12 states in the Mississippi River Basin to produce a plan to reduce the amount of phosphorus and nitrogen carried in rivers throughout the states and to the Gulf of Mexico. Over the last few decades, State and local efforts to control nutrients have yielded positive results, but new and expanded strategies are needed to secure the future health of our water throughout Illinois and the Mississippi River Basin.
In 2011, U.S. EPA provided a recommended framework for state plans. The Illinois NLRS builds upon existing programs to optimize nutrient loss reduction while promoting increased collaboration, research, and innovation among the private sector, academia, non-profits, wastewater agencies, and state and local government. The Illinois NLRS is a framework for using science, technology, and industry experience to assess and reduce nutrient loss to Illinois waters and the Gulf of Mexico. The overall objective of the strategy is to improve water quality, not only in Illinois, but downstream, to reduce the hypoxic zone in the Gulf of Mexico.
The NLRS sets a long-term goal of reducing loads from Illinois for total phosphorus and total nitrogen by 45%, with interim reduction goals of 15% nitrate-nitrogen and 25% total phosphorus by 2025. As identified in the strategy, three sectors (agriculture, point source, and urban stormwater) are sources of nutrient loss in Illinois. For each of these sectors, measures of implementation help provide a full scope of efforts and accomplishments in the State to achieve NLRS goals. The Strategy directs efforts to reduce nutrients from point and non-point sources in a coordinated (primarily voluntary) and cost-effective manner. The full strategy and links to reports can be found here.
The Agriculture Water Quality Partnership Forum (AWQPF)
According to the Hypoxia Task Force Nonpoint Source Measures Workgroup's report, when tracking Best Management Practice (BMP) implementation the parameters to document are location, type of conservation practice, applied amount or practice units, and when the practice was applied. The group identified a host of potential measures, and determined that a practice summary is the most fitting common measure amongst the states to account for and track N and P reduction progress over time and the collective effort of practice implementation through state, federal and local partners. The Workgroup decided to employ a broad interpretation of practice implementation. This means tracking an all-encompassing look at practices, including land use, at various points along the landscape and within parts of the basin that can be expected to influence nutrient loading.
The Agriculture Water Quality Partnership Forum (AWQPF) Technical Subcommittee consists primarily of State and Federal Agencies tasked with tracking and reporting data for BMPs identified in the Illinois NLRS. Members of this group agreed to adhere to the Hypoxia Task Force recommendation, meeting their objective of determining which BMP implementation parameters to track. A comprehensive list of AWQPF members and forum progress can be found here.
For the first Illinois NLRS Biennial Report, data from the year 2011 was used as a baseline and compared to data from 2015 to determine changes in implementation. For some programs, data was aggregated at the state level, while others also provided data on the hydrologic unit code (HUC) 8 scale.
Federal data sources include:
- Cost-share programs from Farm Service Agency (FSA)
- Natural Resource Conservation Service (NRCS)
- Illinois Environmental Protection Agency (Illinois EPA)
- FSA provided information from Conservation Reserve Program (CRP) enrollments for the selected BMPs
- Farmer-reported data for cover crops was also included by FSA
- NRCS provided statewide enrollment acres for the Conservation Stewardship Program
- Statewide acres enrolled in the Wetland Reserve Easement program was also reported
- Environmental Quality Incentives Program (EQIP)
- Through the Section 319(h) Nonpoint Source Grant Program, Illinois EPA tracks site-specific implementation of all BMPs cost-share. Besides just reporting on the amount of implementation of select practices for the Biennial Report, the 319 Program also estimates nutrient and sediment load reductions for each BMP.
State data sources include:
- The Conservation Reserve Enhancement Program (CREP) administered by the Illinois Department of Natural Resources (IDNR)
- Illinois Department of Agriculture - Partners for Conservation Program
- Illinois Department of Agriculture - Streambank Stabilization and Restoration Program
Implementation information and data conducted by industry and non-governmental organizations is also tracked and reported on a voluntary basis. Several organizations reported on the activities implemented through the Regional Conservation Partnership Program (RCPP) they are associated with. Other data included farm organization grants and activities related to education and outreach. A National Agriculture Statistic Service (NASS) survey was developed and mailed to a subset of farmers to gage knowledge of the NLRS and recommended practices in order to track implementation of BMPs outside of cost-share programs. Additional information on NLRS strategy development documents can be found here.
How is IDNR involved?
The Illinois NLRS provides a guideline to reduce nutrient loads from wastewater treatment plants and urban areas, as well as keeping expensive fertilizer in the fields for the crops and out of our waterways. CREP is one of many methods/strategies contributing to the reduction of these nutrient loses.
IDNR's division of Private Lands works directly with landowners and coordinates with other State Agencies to maximize benefits on the farm and in the streams. This is done through education and conversations with farmers, site visits and technical support, and/or facilitating landowners' participation in appropriate conservation programs. In addition, the agency works to reduce other sources of nutrients. The IDNR tracks urban impacts – BMP implementation parameters (e.g. stormwater BMP installations), also provides education about stormwater issues to governmental decision makers and discussion of large-scale conversion of agricultural land to former habitat (e.g. tile removal - wetland restoration).
CREP contributions to NLRS
Illinois consists of more than 22 million acres of corn and soybeans (60 percent of the state's land area). The goal of the Illinois NLRS for farmers is to select and apply the most beneficial practices for any given field. These practices are based on the science assessment and are those deemed by the Illinois NLRS Policy Working Group to have the greatest potential impact based on available research. The specific suite of practices appropriate for any given field will depend on many factors including soil characteristics, landscape position and hydrology, and current cropping and management practices. The NLRS has identified measures that would address nutrient reductions (see list below). Of those, several can be accomplished through CREP.
- reduce N rate from background
- nitrification inhibitor with fall fertilizer
- two split applications of fall and spring
- one spring-only application
- three split applications
- cover crops on tile drained
- cover crops on non-tile
- bioreactors
- buffers on crop land
- perennial/energy on tile drained
The Conservation Reserve Enhancement Program (CREP) is driven by locally-led conservation efforts and employs a variety of BMPs to protect and restore riparian corridors. The table below shows CREP practices that were identified by the NLRS science assessment as measures to be tracked. The acres listed are only for easements where the Federal CREP contract has expired, and they are solely on the State side of the CREP program so as not to double report with the federal CRP program.
| practice acres | BMP | 2011 | 2012 | 2013 | 2014 | 2015 | 2016 | 2017 | 2018 | 2019 |
| CP9, CP23 | Wetland | 20 | 651 | 3,681 | 11,976 | 17,406 | 19,467 | 19,523 | 19,523 | 19,523 |
| CP21, CP22 | Buffer | 526 | 1,324 | 2,720 | 5,467 | 8,768 | 13,568 | 13,764 | 13,850 | 13,855 |
| CP2, CP4D | Perennial/Energy | 0 | 7 | 84 | 1,622 | 2,107 | 4,395 | 4,670 | 4,718 | 4,726 |
| Total NLRS Acres | 546 | 1,981 | 6,484 | 19,065 | 28,281 | 37,430 | 37,956 | 38,091 | 38,104 |
The CREP practices identified for the NLRS do not represent all CREP practices that could result in nutrient loss reduction. CREP has several other practices that are not identified as contributing BMPs at this time by the NLRS Science Assessment, but perhaps could be in the future. This table below lists all CREP practices and acreages associated with CREP from the start of the program until 2019. The acres listed are only for where the Federal CREP contract has expired, and they are solely on the State side of the CREP program.
| |
Wetland acres |
Buffer acres |
Perennial acres |
Other CREP acres |
Additional
acres
|
| |
CP9 CP23 |
CP21 CP22 |
CP2 CP4D |
CP11 CP12 CP3 CP3A | |
| 1999 | 0 | 0 | 0 | 9 | 5,031 |
| 2000 | 0 |
0 | 0 | 9 |
12,165 |
| 2001 | 0 | 17 |
0 |
9 |
20,057 |
| 2002 | 0 | 23 | 0 | 9 |
24,024 |
| 2003 | 0 | 23 | 0 |
9 | 24,327 |
| 2004 | 0 |
41 | 0 | 9 | 26,738 |
| 2006 | 0 | 41 | 0 |
9 |
26,940 |
| 2007 | 11 |
61 | 0 | 15 |
29,668 |
| 2008 | 11 |
107 |
0 | 15 | 32,050 |
| 2009 | 11 | 119 | 0 | 15 |
32,050 |
| 2010 | 11 | 201 | 0 |
15 | 32,050 |
| 2011 | 20 | 526 | 0 | 22 | 33,487 |
| 2012 | 651 | 1,324 | 7 | 30 | 36,308 |
| 2013 | 3,681 | 2,720 | 84 | 156 |
37,441 |
| 2014 | 11,976 | 5,467 |
1,622 | 1,134 | 38,525 |
| 2015 | 17,406 | 8,768 | 2,107 | 1,697 | 38,746 |
| 2016 | 19,467 | 13,568 | 4,395 | 3,415 | 38,797 |
| 2017 | 19,523 | 13,764 |
4,670 | 3,444 | 38,976 |
| 2018 | 19,523 | 13,850 | 4,718 | 3,451 |
39,083 |
| 2019 | 19,523 |
13,855 | 4,726 | 3,451 | 39,148 |
**acres refer to calculations done in GIS, and may vary slightly from the other acres in the CREP Annual Report. This is due to an on-going effort to map accurate CREP boundaries and acres, which are subject to change slightly again in subsequent reports as more accurate boundaries are mapped. The date column is the federal fiscal year when that ground became part of the State CREP easement.
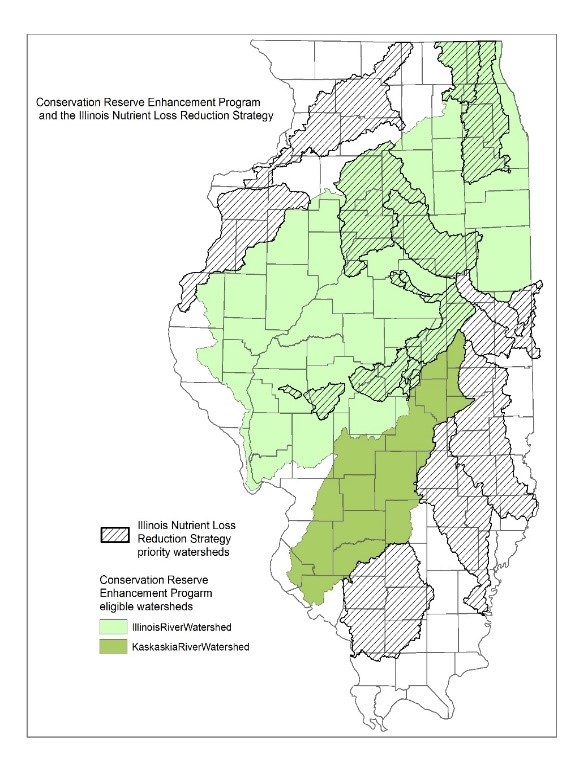
NLRS and CREP
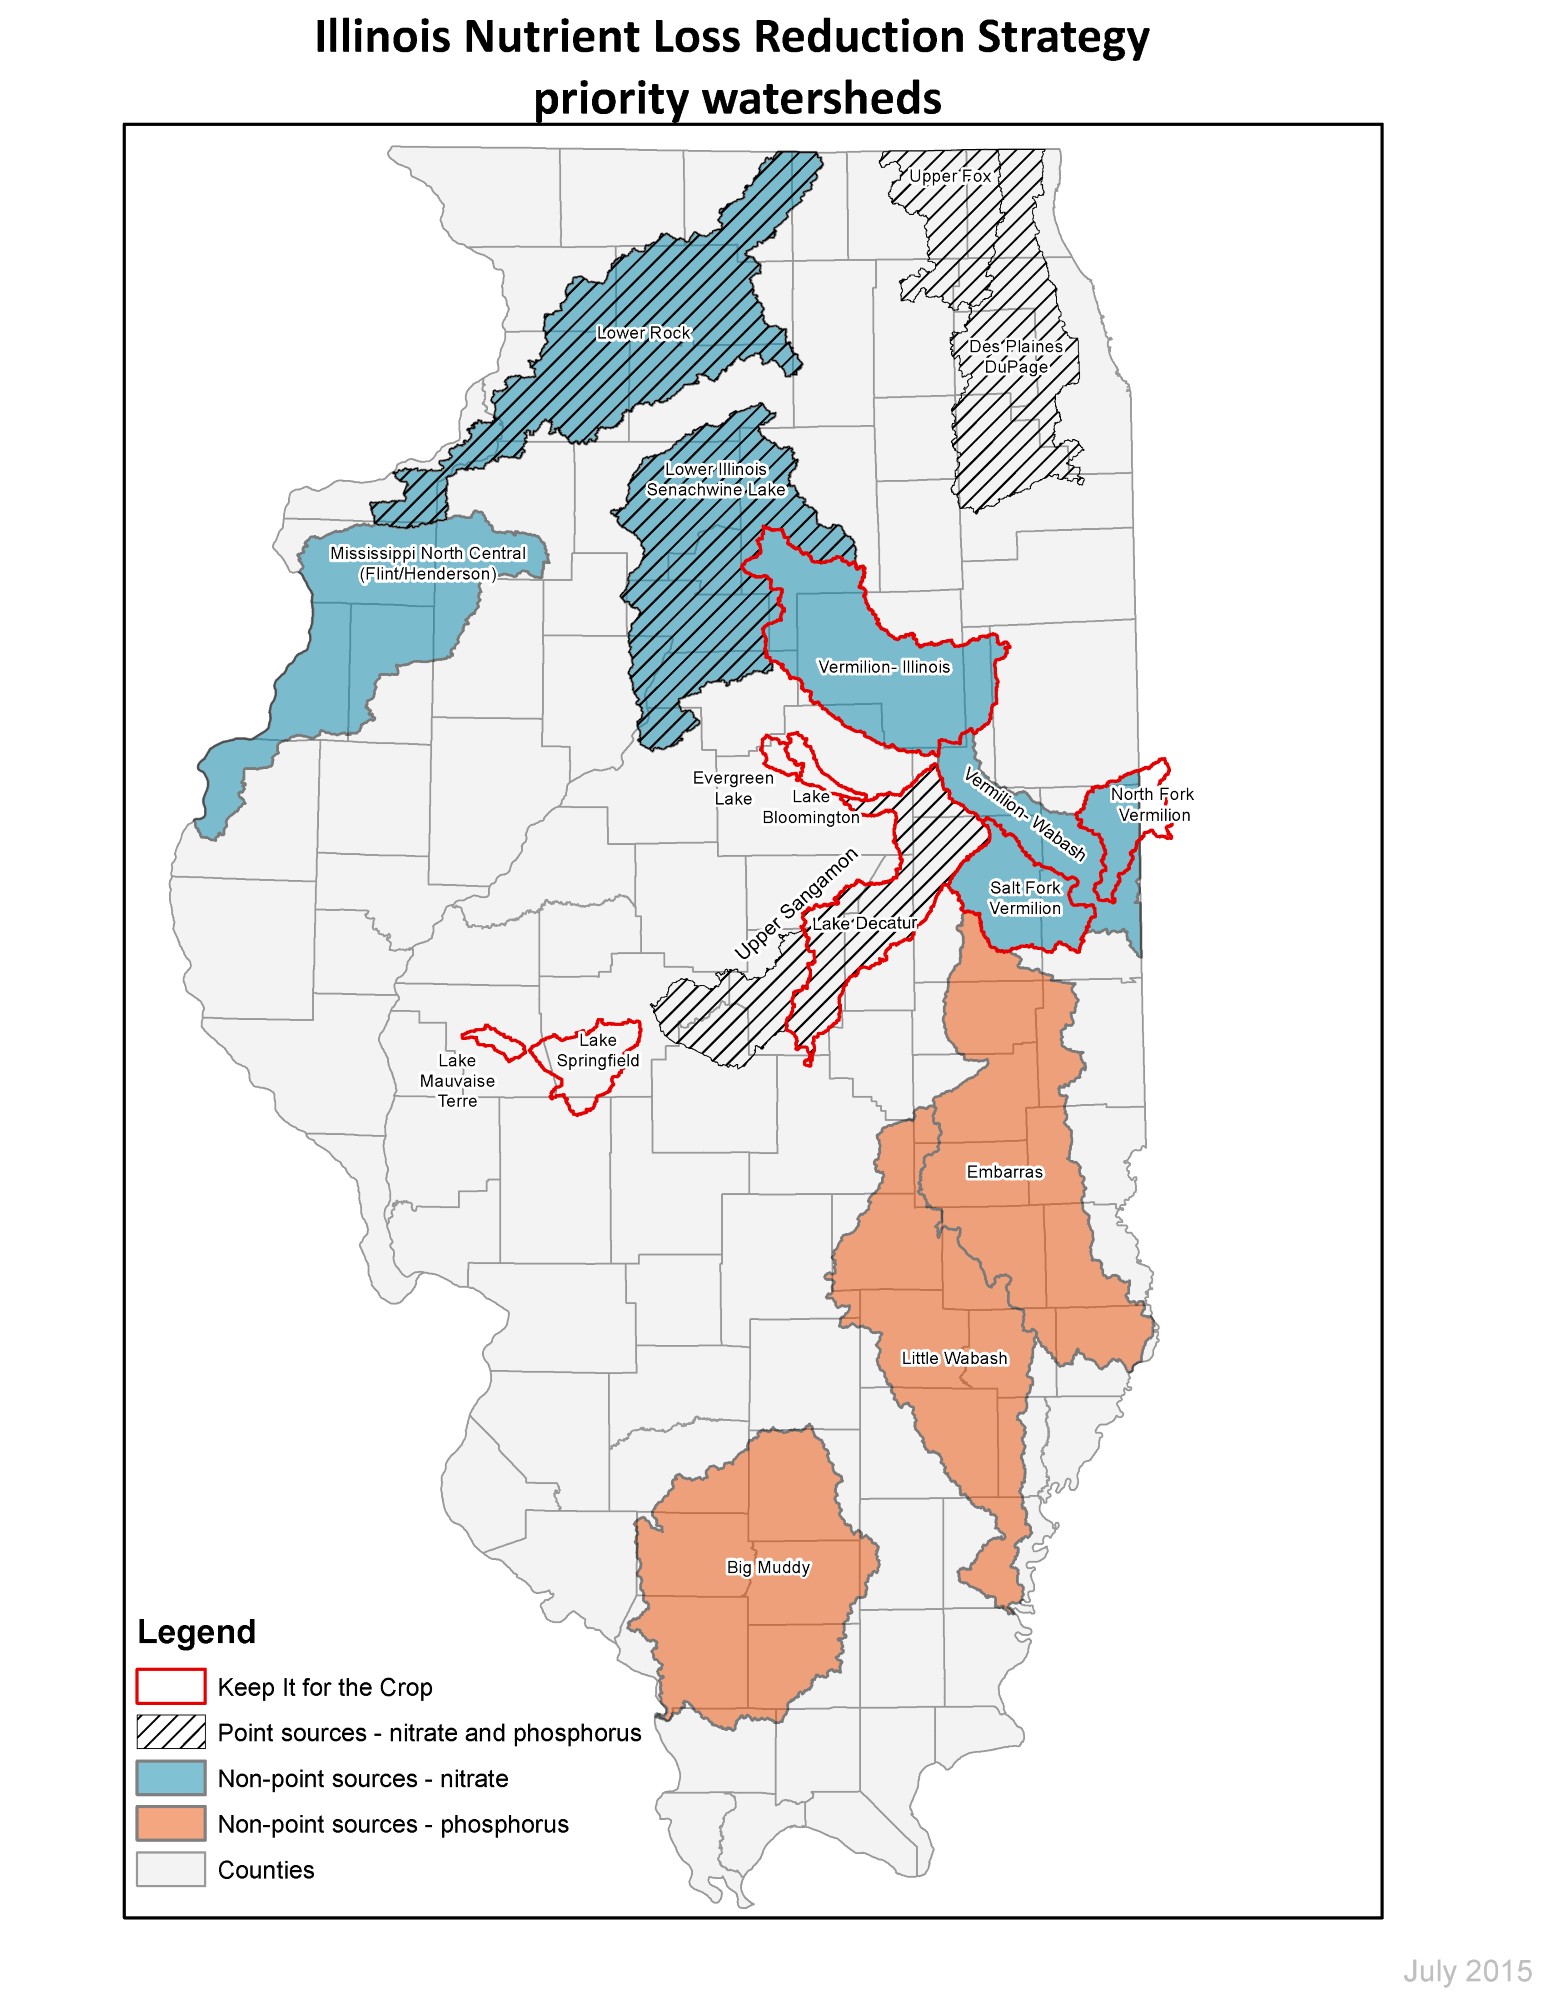
NLRS Priority Watersheds